boss_notes/T-18_Circle_Diagram.md
7.7 KB · commit d2f3b6e
← T-17b: Blocked Rotor Test | 🏠 Index | T-19: Starting Methods (3-Phase) →
T-18: Circle Diagram
Section: B | Priority: 🟠 HIGH | Exam Frequency: 4/7 years Sources: Theraja Ch-35 (Art. 35.9-35.14), Slides L-07
Why This Topic Matters
Circle diagram problems appeared in 4 out of 7 papers (2017, 2018, 2019, 2021). Each problem is worth 6-9 marks. The trend is declining (absent in 2023, 2024), but it remains in syllabus and can return. The construction is mechanical: once you know the steps, it is guaranteed marks.
📝 Key Definitions
Circle Diagram: "The locus of the stator current phasor of an induction motor, as the load changes from no-load to blocked rotor, is approximately a semicircle. This semicircle, called the circle diagram, can be used to predict the performance of the motor at any load." — Theraja, Art. 35.9
Data Required
You need two test results:
| Test | Measurements | What It Gives |
|---|---|---|
| No-Load | V0, I0, P0 (or cosϕ0) | No-load point on circle |
| Blocked Rotor | Vsc, Isc, Psc (or cosϕsc) | Short-circuit point on circle |
Both must be referred to the same (rated) voltage.
Construction Steps
Step 1: Scale BR data to full voltage
If BR test was at reduced voltage Vsc:
Isc,full=Isc×VscVrated
Power factor stays the same: cosϕsc=Psc/(3VscIsc)
Step 2: Calculate angles
ϕ0=cos−1(3V0I0P0)
ϕsc=cos−1(cosϕsc)
Step 3: Plot points
On a graph with horizontal axis = active current (watts component) and vertical axis = reactive current:
No-load point O′:
- Ox′=I0cosϕ0, Oy′=I0sinϕ0
Short-circuit point S:
- Sx=Isc,fullcosϕsc, Sy=Isc,fullsinϕsc
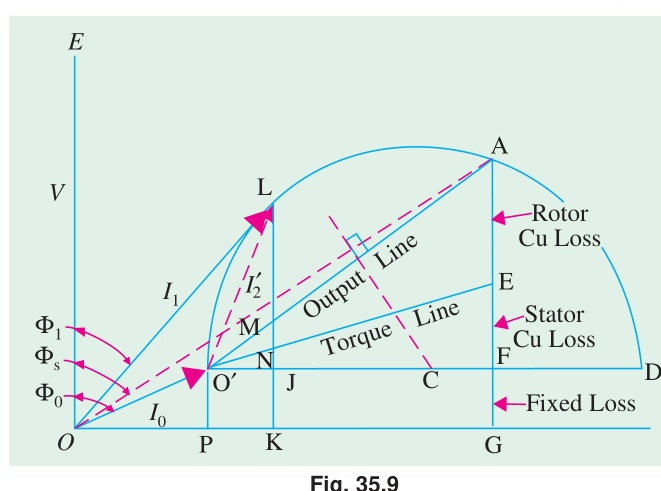
Step 4: Draw the circle
Draw a semicircle through O′ and S. The center lies on a horizontal line through O′.
Step 5: Draw the power and torque lines
- Output line: Horizontal line from O′ (no-load point)
- Torque line (air-gap line): Connects O′ to a point on the S-line divided by the rotor/total Cu loss ratio.
- The rotor Cu loss line divides the SC intercept in the ratio of rotor Cu loss to total Cu loss at standstill.
If rotor Cu loss = stator Cu loss at standstill (equal division), the line bisects the vertical intercept.
Step 6: Read performance
For any operating point on the circle:
- Vertical distance below power line = output power
- Vertical distance below torque line = developed torque (in sync watts)
- Power factor = cos of angle between current vector and voltage reference
What the Circle Diagram Can Predict
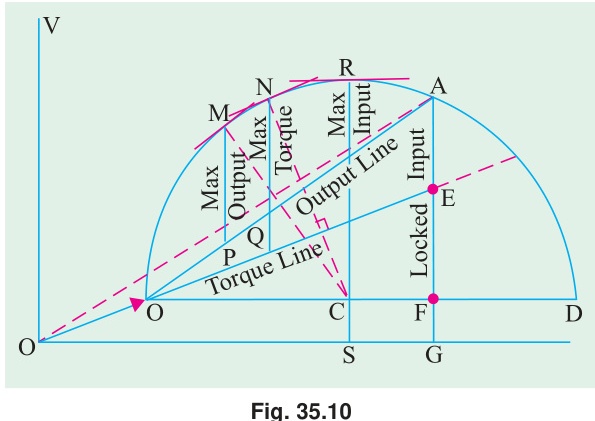
| Quantity | How to Read |
|---|---|
| Line current | Length of current vector from origin to operating point |
| Power factor | Cosine of angle between current vector and horizontal |
| Output power | Vertical height above output line, times voltage scale |
| Max output | Longest vertical intercept below output line |
| Max torque | Longest vertical intercept below torque line |
| Slip | Ratio of rotor Cu loss segment to total air-gap segment |
| Efficiency | Output segment / input segment |
🏆 Golden Questions (Past Exam Archive)
🎯 Q1: Circle diagram: 415V, delta, 50 Hz motor. NL: 415V, 21A, 1250W. BR: 100V, 45A, 2730W. Find line current and pf at rated output.
Appeared: 2017 Q3(b), 2019 Q6(a) — (9 marks)
Full Answer:
No-load data: V=415 V (delta), I0=21 A (line), P0=1250 W
cosϕ0=3×415×211250=150941250=0.0828,ϕ0=85.25°
Blocked rotor (scaled to 415V):
Isc,full=45×415/100=186.75 A
cosϕsc=3×100×452730=0.35,ϕsc=69.5°
Plot points O′ and S on the circle diagram. Draw the semicircle. Locate the operating point for rated output (29.84 kW).
Power scale: 3×415=718.7 W per ampere of active component.
From diagram: Line current at rated output ≈58 A. Power factor ≈0.714 lagging.
🎯 Q2: Circle diagram: 5.6 kW, 400V, 4-pole, 50 Hz slip-ring IM. NL: 6A, cosϕ0=0.087. BR: 100V, 12A, 720W. R1=0.67Ω, R2=0.185Ω. Find full-load current, slip, pf, max power.
Appeared: 2018 Q7(b) — (8 marks)
Full Answer:
Scale BR to full voltage:
Isc=12×400/100=48 A
cosϕsc=720/(3×100×12)=0.347, ϕsc=69.7°
No-load point: I0x=6×0.087=0.52 A, I0y=5.98 A
SC point: Iscx=48×0.347=16.66 A, Iscy=45.02 A
Rotor Cu loss line: Total SC Cu loss at full voltage =720×(400/100)2=11520 W.
Stator Cu loss =3×482×0.67=4631 W. Rotor Cu loss =11520−4631=6889 W.
Ratio: 6889/11520=0.598. The rotor Cu loss line divides the SC intercept at 59.8% from the power line.
From diagram: Full-load current ≈10.5 A, slip ≈6.2%, pf ≈0.78 lagging, max power ≈8.2 kW.
🎯 Q3: Circle diagram: 14.92 kW, 400V, 6-pole. NL: 11A, pf=0.2. SC: 100V, 25A, pf=0.4. Rotor Cu = half total Cu at standstill.
Appeared: 2021 Q8(c) — (6 marks)
Full Answer:
No-load: I0x=11×0.2=2.2 A, I0y=10.78 A
SC (scaled): Isc=25×400/100=100 A, cosϕsc=0.4
Iscx=40 A, Iscy=91.65 A
Plot O′ and S, draw semicircle. Since rotor Cu = stator Cu at standstill, the rotor Cu line bisects the SC intercept at 50%.
Ns=120×50/6=1000 rpm. Power scale: 3×400=692.8 W/A.
For 14.92 kW rated output, locate operating point:
From diagram: Line current ≈30 A, slip ≈5%, efficiency ≈84%, pf ≈0.76 lagging.
Maximum torque = longest vertical intercept below torque line (read from diagram in sync watts).
Exam Variants
| Year | Question | Data | Marks |
|---|---|---|---|
| 2017 Q3(b) | 415V delta, 29.84 kW | NL+BR data | 9 |
| 2018 Q7(b) | 400V, 5.6 kW slip-ring | NL+BR+R1+R2 | 8 |
| 2019 Q6(a) | Same as 2017 | Same problem | 9 |
| 2021 Q8(c) | 400V, 14.92 kW, 6-pole | NL+BR, equal Cu | 6 |
⚡ Exam Tips & Common Mistakes
- Always scale BR data to rated voltage. Current scales linearly with voltage: Isc,full=Isc×Vrated/Vsc. Power factor stays the same.
- Choose a clear current scale. For example: 1 cm = 5 A. Label your scale.
- Delta connection: Iphase=Iline/3. Star: Iphase=Iline.
- The power axis is horizontal. Active current on x-axis, reactive on y-axis.
- The circle diagram is declining in frequency. Absent in 2023 and 2024. But still in syllabus.
- Carry a protractor and compass to the exam for this question.
🔗 Related Topics
- T-17a: No-Load Test — Provides no-load point
- T-17b: Blocked Rotor Test — Provides SC point
- T-14: IM Equivalent Circuit — Analytical alternative
← T-17b: Blocked Rotor Test | 🏠 Index | T-19: Starting Methods (3-Phase) →