boss_notes/T-15c_Torque_Speed_Curves.md
9.7 KB · commit d2f3b6e
← T-15b: Running & Max Torque | 🏠 Index | T-16: Power Flow →
T-15c: Torque-Speed Characteristics
Section: B | Priority: 🟠 HIGH | Exam Frequency: 4/7 years Sources: Theraja Ch-34 (Art. 34.26-34.30), VK Mehta Ch-8 (Art. 8.16), Slides L-04
Why This Topic Matters
"Draw and explain the torque-speed/torque-slip curve" appeared in 4 out of 7 papers. It is a 3-5 mark question every time. You need to draw the curve accurately, label all key points, and explain the stable vs unstable regions. The effect of R2 on the curve shape is also tested.
📝 Key Definitions
Torque-Slip Characteristic: "The curve showing the relation between the torque and the slip (or speed) of an induction motor is called its torque-slip (or torque-speed) characteristic." — Theraja, Art. 34.26
The Torque-Slip Curve
From the torque equation: T=ksE22R2/(R22+s2X22)
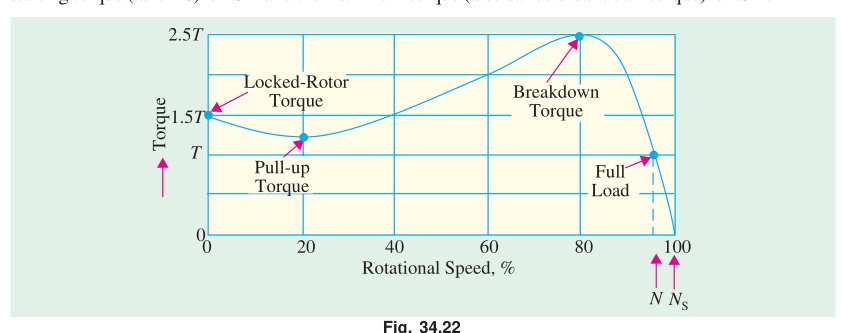
Key points on the curve:
| Point | Slip | Speed | Torque | Notes |
|---|---|---|---|---|
| Synchronous | s=0 | Ns | T=0 | No relative motion |
| Full load | sf≈0.03 | ≈0.97Ns | Tf | Normal operating point |
| Breakdown | smT=R2/X2 | Ns(1−smT) | Tmax | Peak torque |
| Standstill | s=1 | 0 | Tst | Starting torque |
Two Operating Regions
Low-Slip Region (0<s<smT): STABLE
When s is small, (sX2)2≪R22, so:
T≈R22ksE22R2=R2ksE22∝s
Torque is approximately proportional to slip. The curve is nearly linear.
Why this region is stable: If load increases, the motor slows down slightly. Slip increases. Torque increases to match the new load. A self-correcting equilibrium.
High-Slip Region (smT<s≤1): UNSTABLE
When s is large, (sX2)2≫R22, so:
T≈s2X22ksE22R2=sX22kE22R2∝s1
Torque is inversely proportional to slip. The curve falls.
Why this region is unstable: If load increases, the motor slows down. Slip increases. But now torque DECREASES. The motor slows further. Torque drops more. The motor stalls.
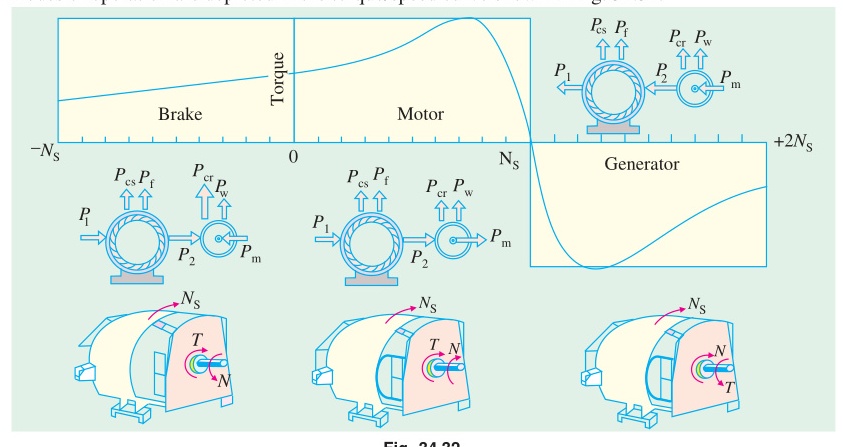
Complete Torque-Speed Curve (All Three Regions)
| Region | Speed Range | Slip Range | Description |
|---|---|---|---|
| Motoring | 0<N<Ns | 0<s<1 | Normal operation |
| Generating | N>Ns | s<0 | Driven above Ns, feeds power back |
| Braking (Plugging) | N<0 | s>1 | Rotor rotates against stator field |
Effect of Rotor Resistance on Torque-Speed Curve
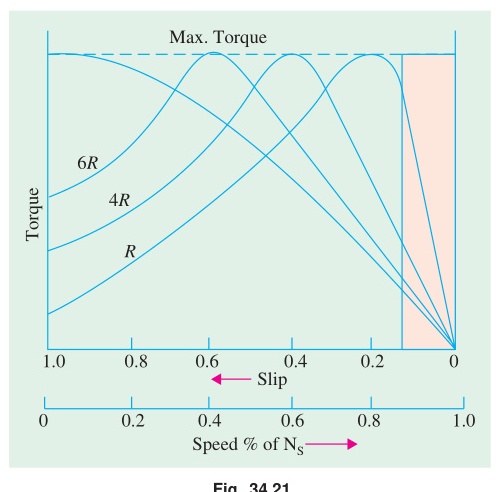
Increasing R2 (by adding external resistance in wound-rotor motor):
- Tmax stays the same (kE22/2X2, no R2 in formula)
- smT increases (smT=R2/X2, peak shifts to higher slip = lower speed)
- Starting torque Tst increases (up to R2=X2, where Tst=Tmax)
- Beyond R2=X2: Tst decreases again
Practical use: In wound-rotor motors, external resistance gives maximum starting torque and smooth acceleration of heavy loads.
🏆 Golden Questions (Past Exam Archive)
🎯 Q1: Derive torque-slip characteristics of a 3-phase IM and explain.
Appeared: 2020 Q8(b) — (3 marks)
Full Answer:
Torque equation: T=ksE22R2/(R22+s2X22)
At s=0: T=0 (synchronous speed, no relative motion).
As s increases from 0: Torque increases. In the low-slip region, T∝s (linear).
At s=smT=R2/X2: T=Tmax (breakdown torque).
For s>smT: Torque decreases. (sX2)2 term dominates the denominator. T∝1/s.
At s=1: T=Tst (starting torque, typically 1.5-2 times Tf).
The motor operates stably only in the region 0<s<smT. In this region, if load increases, slip increases and torque increases to match. Beyond smT, the motor is unstable and will stall if load exceeds Tmax.
🎯 Q2: Draw the complete torque-speed curve of an induction motor.
Appeared: 2021 Q3(c) — (3 marks)
Full Answer:
The complete curve covers three regions:
Motoring region (0<N<Ns, 0<s<1):
- At N=0 (s=1): Starting torque Tst
- Maximum torque Tmax at smT=R2/X2
- At N=Ns (s=0): Torque = 0
Generating region (N>Ns, s<0):
- Rotor driven above synchronous speed by external prime mover
- Negative torque: machine delivers power back to supply
Braking/Plugging region (N<0, s>1):
- Rotor rotates opposite to stator RMF direction
- Large braking torque developed
- Used for rapid stopping
🎯 Q3: Explain the effect of rotor resistance on the torque-speed characteristic curve.
Appeared: 2024 Q7(b) — (3 marks)
Full Answer:
From smT=R2/X2 and Tmax=kE22/(2X2):
Increasing rotor resistance R2:
- smT increases: The peak torque shifts to higher slip (lower speed).
- Tmax remains unchanged: No R2 in the formula.
- Starting torque Tst increases as R2 increases, up to R2=X2 where Tst=Tmax.
By selecting appropriate external resistance, the wound-rotor motor can develop maximum torque at any desired speed. This is used for smooth starting of heavy loads and step-speed control.
🎯 Q4: Derive the torque expression T=ksE22R2/(R22+s2X22).
Appeared: 2023 Q5(a) — (8 marks)
Full Answer:
At running slip s, per-phase rotor quantities:
Rotor EMF: E2s=sE2. Rotor reactance: X2s=sX2.
Rotor current: I2=sE2/R22+s2X22
Rotor power factor: cosϕ2=R2/R22+s2X22
Air-gap power using R2/s model:
Pg=3I22⋅sR2=3⋅R22+s2X22s2E22⋅sR2=R22+s2X223sE22R2
Torque = air-gap power / synchronous angular speed:
T=ωsPg=2πnsPg=(R22+s2X22)⋅2πns3sE22R2
T=R22+s2X22ksE22R2,k=2πns3
🎯 Q5: What happens to torque and speed if supply frequency increases suddenly?
Appeared: 2021 Q6(a) — (4 marks)
Full Answer:
If supply frequency f increases suddenly (with voltage V unchanged):
-
Ns increases (Ns=120f/P). Rotor cannot follow instantly, so slip increases momentarily.
-
X2=2πfL2 increases proportionally with f.
-
Tmax=kE22/(2X2)∝V2/f2 decreases. Since X2∝f and V is constant, Tmax drops significantly.
-
Operating slip increases because the motor must develop the same load torque with reduced Tmax. The motor operates closer to pull-out: less stable.
-
Speed may change: New Ns is higher, but the rotor only partially catches up.
This is why VFDs change V and f together (constant V/f ratio) to maintain constant flux and torque capability.
🎯 Q6: 6-pole, 400V, 50 Hz, star. R2′=0.5Ω, X2′=2.0Ω. sf=4%. Find Tst, Tf, Tmax, efficiency (mech losses = 500 W).
Appeared: 2024 Q6(b) — (5 marks)
Full Answer:
Ns=1000 rpm =50/3 rps. k=3/(2π×50/3)=0.02865
Vϕ=400/3=231.0 V. E2′≈Vϕ=231.0 V.
Starting torque (s=1): Tst=0.25+4.00.02865×1×2312×0.5=4.25764.7=179.9 N-m
Full-load torque (s=0.04): Tf=0.25+0.00640.02865×0.04×53361×0.5=0.256430.55=119.2 N-m
Maximum torque: Tmax=4.00.02865×53361=382.2 N-m
Efficiency: Pg=Tf×ωs=119.2×104.72=12483 W
Pm=(1−s)Pg=0.96×12483=11983 W
Pout=11983−500=11483 W
η≈1248311483×100=92.0%
Exam Variants
| Year | Question | Key Focus |
|---|---|---|
| 2020 Q8(b) | Derive and explain T-s characteristics | Theory |
| 2021 Q3(c) | Draw complete T-speed curve (all 3 regions) | Drawing |
| 2021 Q6(a) | Effect of frequency change on torque/speed | Conceptual |
| 2023 Q5(a) | Derive torque expression (8 marks) | Full derivation |
| 2024 Q6(b) | 6-pole numerical with efficiency | Numerical |
| 2024 Q7(b) | Effect of R2 on T-speed curve | Theory |
⚡ Exam Tips & Common Mistakes
- Label ALL key points on the curve: Tst, Tmax, Tf, smT, Ns. Missing labels lose marks.
- Stable region is LEFT of the peak (low slip side). Unstable is RIGHT of the peak.
- Draw the curve starting from s=0 (right side) going to s=1 (left side) if plotting vs speed. Or s=0 (left) to s=1 (right) if plotting vs slip. Be consistent.
- When sketching effect of R2: Draw 3-4 curves with the SAME Tmax but peaks at different slips.
🔗 Related Topics
- T-15a: Starting Torque — The s=1 end of the curve
- T-15b: Running & Max Torque — The equations behind the curve
- T-20: Speed Control — Practical use of R2 variation
← T-15b: Running & Max Torque | 🏠 Index | T-16: Power Flow →